GIS advantages and disadvantages
Advantages:
- in a free gis software, a map is a truly dynamic object;
- variable scale;
- the ability to transform cartographic projections;
- the ability to vary the object composition of the map (what is displayed on the screen);
- the ability to receive a database in real time through the map;
- changeable ways of displaying objects (colors, line types, symbols);
- any changes are easily made;
- automated calculation of lengths, areas;
- the ability to enter any amount of information on the card;
- prompt change of data;
- visual representation of semantic information from the database due to the display of the relative spatial location of the data;
- the possibility of increasing the information capacity of the product due to the connection of spatially oriented images with semantic information from the database;
Disadvantages:
- great dependence of GIS work on the initial geographic data;
- dependence of the final result on the accuracy and clarity of the data transferred to the GIS;
- some difficulty in analyzing objects, but this problem can be solved using plug-ins, or by customizing the system to solve specific problems.
Undoubtedly, the purchase, implementation and further use of GIS will only bring positive results, solving many of our problems.
The main purpose of GIS is considered to be the formation of knowledge and phenomena, processes on Earth and their further application to solve the necessary problems in all spheres of human life.
GIS is currently a modern integrated system that meets the requirements of the informatization of society, used in all directions. It contributes to the solution of managerial, economic problems, based on the means and methods of informatization.
The system is constantly being improved and developed in the following directions:
- the theory and practice of information systems is developing;
- the experience of working with spatial data is studied and summarized;
- research and development of concepts for creating systems of space-time models;
- technologies of automated production of electronic and digital cards are being improved;
- technologies for visual data processing are being developed;
- methods of decision support are being developed;
input:
For use in GIS, the data must be converted to a suitable digital format. The process of converting data from paper maps into computer files is called digitization. In modern learning gissolution, this process can be automated using scanner technology, which is especially important when carrying out large projects, or, with a small amount of work, data can be entered using a digitizer. Many data have already been translated into formats that are directly perceived by GIS packages.
Manipulation:
Often, to complete a specific project, the existing data needs to be additionally modified in accordance with the requirements of your system. For example, geographic information can be at different scales (street centerlines are at a scale of 1: 100,000, census district boundaries are at a scale of 1: 50,000, and residential properties are at a scale of 1: 10,000). For joint processing and visualization, it is more convenient to present all data on a single scale. GIS technology provides different ways to manipulate spatial data and highlight the data needed for a specific task.
Control:
In small projects, geographic information can be stored as regular files. But with an increase in the amount of information and an increase in the number of users for storing, structuring and managing data, it is more efficient to use database management systems (DBMS), then special computer tools for working with integrated data sets (databases). In GIS, it is most convenient to use a relational structure in which data is stored in tabular form. In this case, common fields are used to link tables. This simple approach is flexible enough and is widely used in many GIS and non-GIS applications.
Query and Analysis:
If you have GIS and geographic information, you can get answers to simple questions (Who is the owner of this land plot? At what distance are these objects from each other? Where is this industrial zone located?) And more complex queries that require additional analysis (Where are the places for construction a new house?
What is the main soil type under spruce forests? How will the construction of a new road affect traffic?). Queries can be set both by a simple mouse click on a specific object, and with the help of advanced analytical tools. With the help of GIS, one can identify and set patterns for search, play scenarios like “what will happen if…”. Modern GIS has many powerful analysis tools, of which two are the most significant: proximity analysis and overlay analysis. To analyze the proximity of objects relative to each other, GIS uses a process called buffering. It helps answer questions like: How many houses are within 100 meters of this body of water?
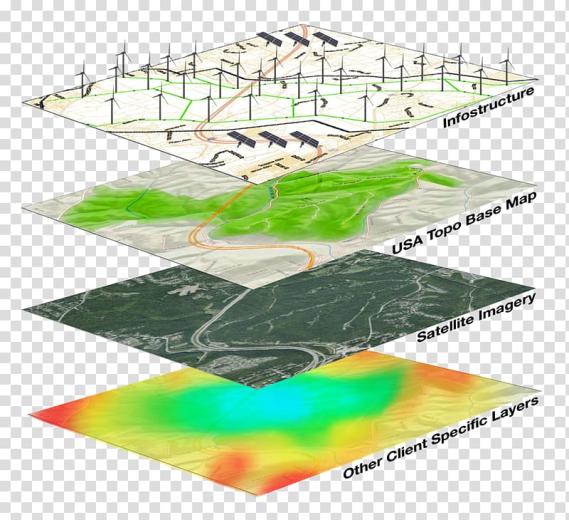
How many customers live within 1 km of this store? What is the share of oil produced from wells located within 10 km from the management building of this oil and gas production department? The overlay process involves integrating data located in different thematic layers. In the simplest case, this is a display operation, but in a number of analytical operations, data from different layers are physically combined.
Overlay, or spatial aggregation, allows, for example, to integrate soil, slope, vegetation, and tenure data with land tax rates. It helps answer questions like: How many houses are within 100 meters of this body of water? How many customers live within 1 km of this store? What is the share of oil produced from wells located within 10 km from the management building of this oil and gas production department? The overlay process involves integrating data located in different thematic layers. In the simplest case, this is a display operation, but in a number of analytical operations, data from different layers are physically combined. Overlay, or spatial aggregation, allows, for example, to integrate soil, slope, vegetation, and tenure data with land tax rates.

Why Do Candidates Fail In The Atlassian ACP-600 Certification Exam?
- Today, there is a lot of hype about Search Engine Optimisation. are we delighted that they are buying

Why Do Candidates Fail In The VMware 2V0-21.20 Certification Exam?
- Homeschooling textbooks definitely certainly are a vital staple in a very quite dad and mom electricity to house school their youngster or little ones

Tips: Get Oracle Certification Through 1Z0-066 Exam
- Solutions for your career oriented certification. PDF, Practice test software. Get latest and Actual Exam Dumps For Best Results In Final Exam.

Whether you are a junior, senior, project manager, or a top-level manager with 20 years of experience, software project
- The downside to a local device search is that it’s local. At the time of writing, Apple does not share its analysis of your photos between your devices. Every device has to reanalyse your photos